1. Matplotlib에서 Text
1.1 Text in Viz
*Why? * 시각화에서 줄 수 없는 많은 설명 추가 가능 * 잘못된 전달 방지, 오해 방지
- But! 적절히 사용해야 한다
1.2 Anatomy of a Figure
- Title: 가장 큰 주제를 설명
- Label: 축에 해당하는 데이터 정보 제공
- Tick Label: 축에 눈금을 사용하여 스케일 정보 제공
- Legend: 한 그래프에서 2개 이상의 서로 다른 데이터를 분류 해주는 보조 정보
- Annotation(Text): 그 외의 설명 추가
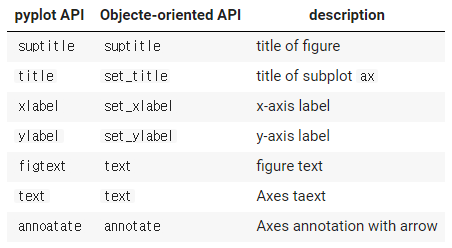
1.3 Text API
2. Text Properties
- font
- Details
- color, linespacing, background color, alpha, zorder, visible
- Alignment
- ha, va, rotation, multialignment
- Box 그리기
- bbox
- others
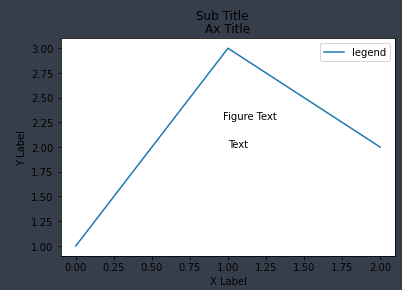
2.1 Text 표시하기
- 코드
fig, ax = plt.subplots()

fig.suptitle('Sub Title')

ax.plot([1, 3, 2], label='legend')
ax.legend()

ax.set_title('Ax Title')
ax.set_xlabel('X Label')
ax.set_ylabel('Y Label')

ax.text(x=1,y=2, s='Text') # x=1, y=2 위치에 s 표시
fig.text(0.5, 0.6, s='Figure Text') # 좌표 기반 (0.5, 0.6) 위치에 s 표시

plt.show()
- 결과
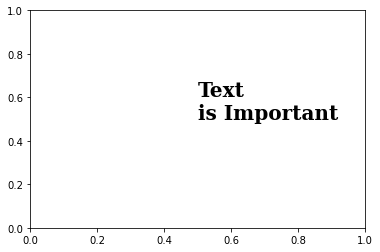
2.2 Details
ax.text(x=0.5, y=0.5, s='Text\nis Important',
	fontsize=20,
	fontweight='bold',
	fontfamily='serif',
#         color='royalblue',
#         linespacing=2,
#         backgroundcolor='lightgray',
#         alpha=0.5
   )
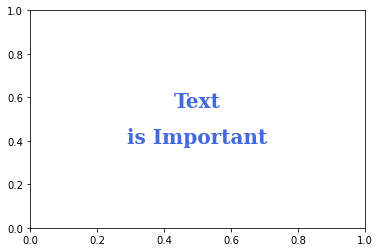
2.3 Alignment
ax.text(x=0.5, y=0.5, s='Text\nis Important',
	fontsize=20,
	fontweight='bold',
	fontfamily='serif',
	color='royalblue',
	linespacing=2,
	va='center', 			# top, bottom, center
	ha='center', 			# left, right, center
	rotation='horizontal' 	# vertical?
   )
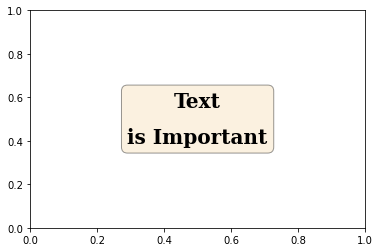
2.4 Advanced box
ax.text(x=0.5, y=0.5, s='Text\nis Important',
	fontsize=20,
	fontweight='bold',
	fontfamily='serif',
	color='black',
	linespacing=2,
	va='center',
	ha='center',
	rotation='horizontal',
	bbox=dict(boxstyle='round', facecolor='wheat', alpha=0.4) # bbox
   )