1. Polar Plot
1.1 Polar Plot
- 극 좌표계
- 거리(distance)과 각(theta)을 사용해 plot
- 회전, 주기성등을 표현
# projection = 'polar' 로 사용 가능
ax = fig.add_subplot(111, projection='polar')

# polar = True 로도 사용 가능
ax = fig.add_subplot(111, polar=True)

'''
set_rmax: 반지름 조정
set_rmin: 원점이 바뀐다 (도넛 형태 X)
set_rticks: 반지름 표기 grid 조정
set_rlabel_position: 반지름 표기 위치 조정
set_thetamin / max: 각도의 최소값 / 최대값
scater, bar형태 모두 사용 가능
'''
1.2 Data Converting
- Grid를 이용
- 직교 좌표계에서 변환 가능
- $X = R cos \theta $
- $Y = R sin \theta $
2. Radar Plot
2.1 Radar Chart
- 극좌표게를 사용하는 대표적인 차트
- 별모양으로 생겨 Star Plot으로 불리기도 함
- 데이터의 Quality를 표현하기에 좋음
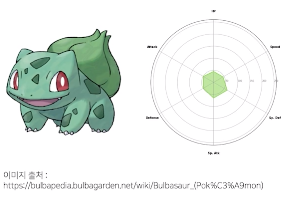
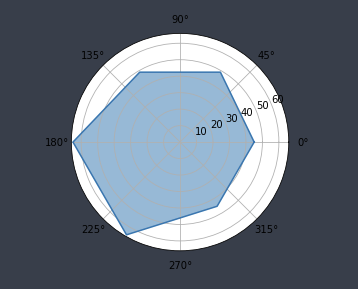
values = pokemon.iloc[0][stats].to_list()

# 2pi를 6으로 나눈 값 (표현 할 feature가 6개)
theta = np.linspace(0, 2*np.pi, 6, endpoint=False)
print(theta)

fig = plt.figure()
ax = fig.add_subplot(111, projection='polar')

values.append(values[0])
# 마지막 선은 그려주지 않기 때문에 마지막 부분 한번더 추가
theta = theta.tolist() + [theta[0]]

# 해당 각 위치에 값을 표시
ax.plot(theta, values)
ax.fill(theta, values, alpha=0.5)

plt.show()

print(values)
print(theta)
2.2 주의점
- Feature가 많아질수록 가독성이 떨어짐